Archive for August 23rd, 2020
» posted on Sunday, August 23rd, 2020 by Linda Lou Burton
Sunday Morning Sidewalk
 Linda Lou Burton posting from Little Rock, Arkansas – It’s Sunday. Did you go to church today? Or do you put yourself in the SBNA column, that is, Spiritual But Not Affiliated? “Organized religion” has been on a worldwide downtrend in recent years; reasons are not crystal-clear, perhaps there is simply more poll-taking. Freedom of Religion, and its first cousin, Freedom of Speech, are the Top-Valued basics we brag about most here in the US of A. When Kayla and Sam and I visited the National Archives on our recent NDI RTW, one of the things we saw in the Rotunda for the Charters of Freedom was The Bill of Rights, adopted December 15, 1791. And the very FIRST Amendment on that list reads like this:
Congress shall make no law respecting an establishment of religion, or prohibiting the free exercise thereof; or abridging the freedom of speech, or of the press; or the right of the people peaceably to assemble, and to petition the Government for a redress of grievances.
Forty-five words that pack a heck of a lot of power. The first thing I get from that part about “religion” is simple: I can choose which religion I want and I can choose not to practice a religion at all if that is my wish. And from the part about “speech,” I understand that I can say, or not say, whatever I please, except, that has been amended a bit to say “don’t tell lies about other people and don’t use filthy language that distresses other people.” Which, of course, has led to many other amendments and arguments about just what “filthy language” IS, and what distresses others. A can of worms there. And sometimes, NOT saying something is considered a real faux pas.
I was thinking about that this morning when I read the story that came out of the Democratic Convention last week about the Pledge of Allegiance. The Democrats were accused of leaving “under God” out of the Pledge. And then AP Fact Check came forward to explain: The Central Programming of the Convention featured the entire Pledge, complete with “under God.” However, the Muslim Delegates and Allies Assembly and the LGBTQ Caucus meeting on Tuesday chose not to include those words. That was not part of the prime-time broadcast.
 That’s a good example of a nitpick. Because the truth of the matter is – we have the right to speak, or not; and we have the right to be religious (whatever that means) or not, but we will be judged on our choices. Yes, I can be a Wiccan or an atheist or a born-again Christian, but along with that choice comes a passel of attitudes that will be formed about me, depending on
  whether or not the other fellow is a Wiccan, or an atheist, or a born-again Christian (or Jew, or Muslim, or SBNA…..)
It’s the way our minds work. We categorize! And in fact, the choices people make DO speak to who they are, and how they think, unless they’re just sheep following the most popular shepherd. No doubt the revelation that VP Candidate Kamala Harris attended  both a black Baptist church and a Hindu temple growing up, and is now married to a Jewish man, will cause some heads to spin. Labels will be stuck to her forehead! And golly gee, look at VP Candidate Mike Pence – he grew up in a Catholic home, then in college he became a born-again Christian and joined a mega-church. So he now identifies as a born-again Catholic, who adheres to the Billy Graham belief that men and women who are not married should not be alone together. And he’s on the ticket with a man who, well, you know that story.
Will our current tickets have a broad enough appeal to pull in almost EVERYBODY? Protestants & Catholics & People Who Once Were Catholics & Jews & SBNAs? Others? Will that get the vote up from the lousy 56% in the 2016 election?
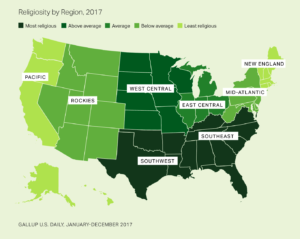
Here are the answers people gave in a 2014 national survey when asked what their “religious preferences” are. There’s a map at the end. (No Religion includes the SBNAs)
United States Percent of Population Religious Practice
- Protestant 46.5%
- Catholic 20.8%
- Mormon 1.6%
- Non-Christian Religion (Islam, Buddhist, Hindu, other) 5.9%
- No Religion 22.8%
Then I broke it down into the top 5 states in each of those categories for a sense of “lay of the land” in case you are campaigning.
Protestant
- Alabama 78%
- Mississippi 77%
- Tennessee 73%
- West Virginia 70%
- Arkansas 70%
Catholic
- Rhode Island 42%
- New Mexico 34%
- New Jersey 34%
- Massachusetts 34%
- Connecticut 33%
Mormon
- Utah 55%
- Idaho 19%
- Wyoming 9%
- Arizona 5%
- Alaska 5%
Non Christian Religion (Islam, Buddhist, Hindu, other)
- New Jersey 14%
- New York 12%
- Hawaii 10%
- District of Columbia 9%
- California 9%
- Massachusetts 9%
No Religion
- Vermont 37%
- New Hampshire 36%
- Washington 32%
- Massachusetts 32%
- Alaska 31%
- Oregon 31%
- Maine 31%
Are you surprised?